About ridgeline
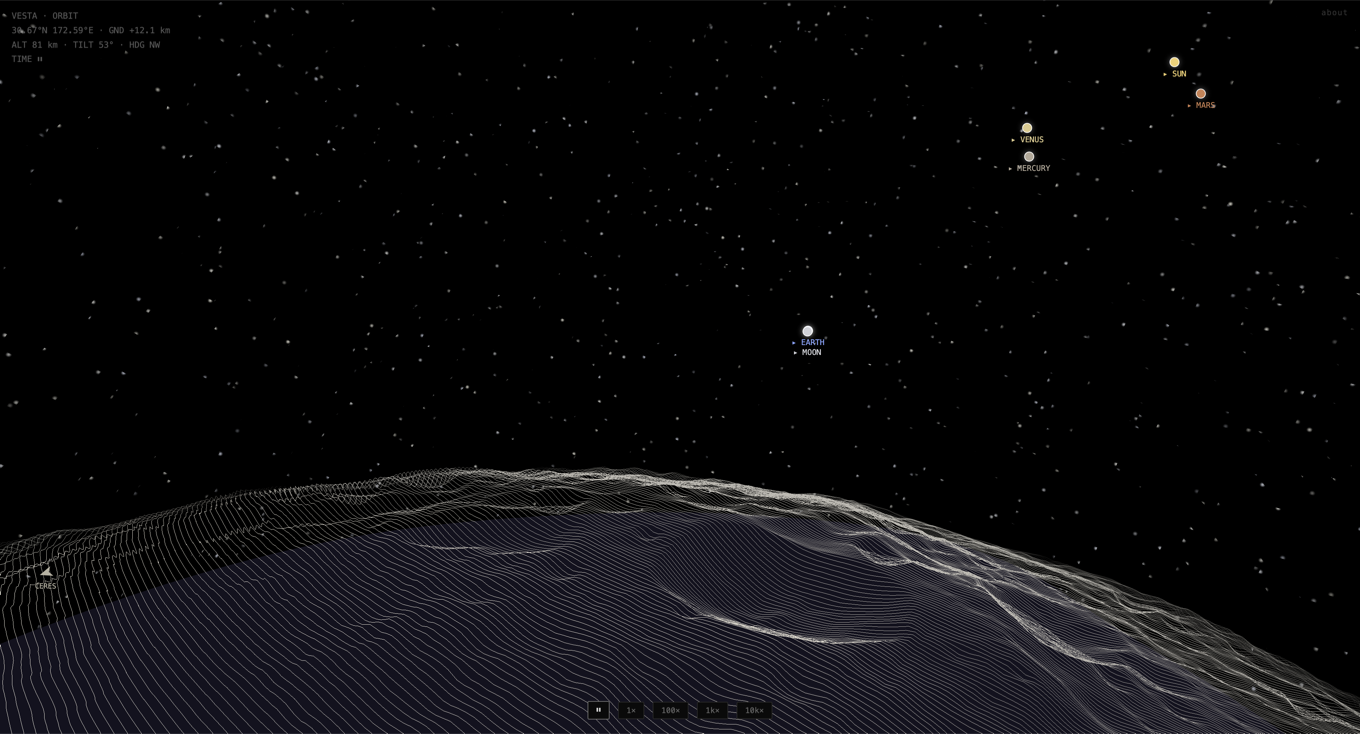
ridgeline draws the solar system as ridgeline graphs. Ten solid bodies for which we have real elevation data: Earth, the Moon, Mars, Venus, Mercury, Ceres, Vesta, Enceladus, Pluto, Charon. For the Sun, we render magnetic field measurements. Each one is a globe of stacked Joy Division “Unknown Pleasures” ridgelines.
github.com/idle-intelligence/ridgeline
Unknown Pleasures
The stacked-ridgeline look is the cover of Joy Division’s 1979 album Unknown Pleasures, designed by Peter Saville. That cover is a real scientific plot: about a hundred stacked radio pulses from the pulsar PSR B1919+21 (now also known as CP 1919), the first pulsar ever discovered, by Jocelyn Bell Burnell and Antony Hewish in 1967.
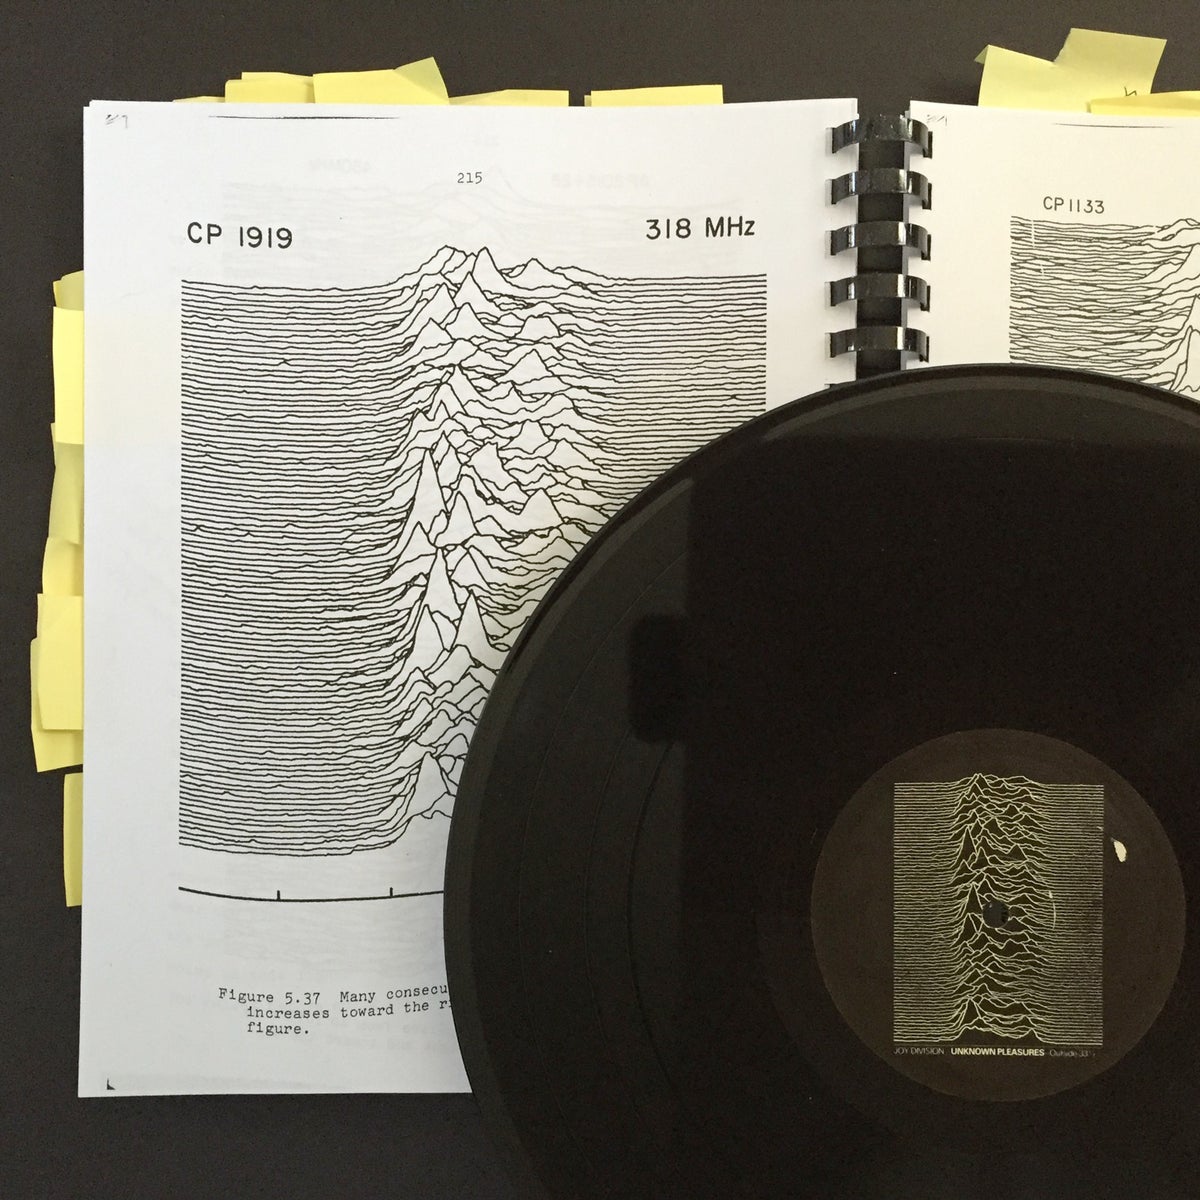
Image: Scientific American.
The stacked-pulse figure was produced by Harold D. Craft Jr. for his 1970 Cornell PhD thesis (from Arecibo data), and reached print through the Cambridge Encyclopaedia of Astronomy (1977) and Scientific American, where Saville found it. Scientific American later tracked down the original figure and interviewed Craft about it.
ridgeline wraps that same stacked-profile idea around planets: each latitude ring is an elevation profile sweeping longitude.
Data sources
Every ridge is measured elevation, or for the Sun measured magnetic field. All sources are public domain or freely redistributable. Grids run from 2880×1440 (Sun) to 12288×6144 (Earth), stored as raw int16.
- Earth NOAA ETOPO 2022 · doc · data
- Moon NASA LRO / LOLA · doc + data
- Mars NASA MGS / MOLA MEGDR · doc + data
- Venus NASA Magellan (via USGS) · doc · data (67 MB)
- Mercury NASA MESSENGER (via USGS) · doc · data (531 MB)
- Ceres & Vesta NASA Dawn (DLR / USGS) · doc · Ceres (467 MB), Vesta (597 MB)
- Enceladus NASA Cassini (Schenk & McKinnon, 2024) · doc · data (130 MB)
- Pluto & Charon NASA New Horizons · doc · Pluto (620 MB), Charon (161 MB)
- Sun NASA SDO / HMI · doc · data
The Sun Magnetic Field
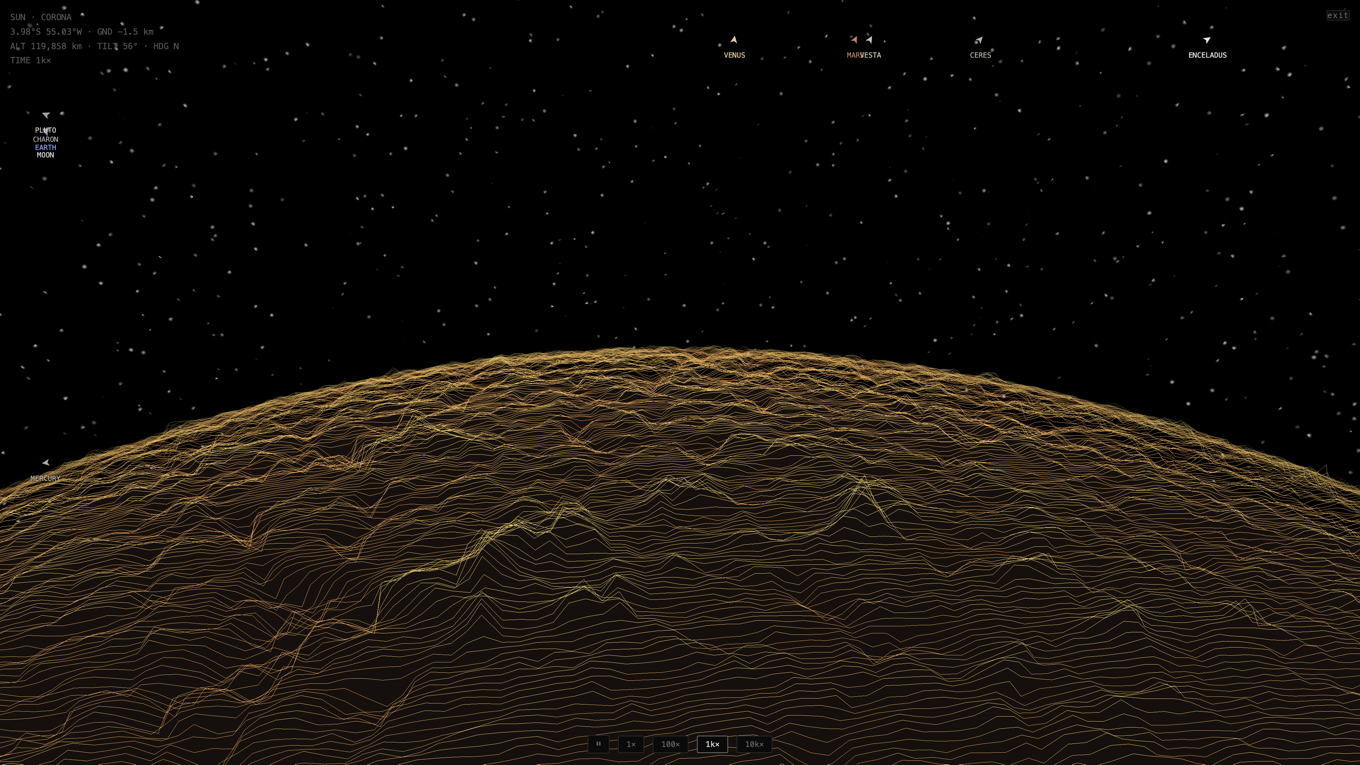
The Sun has no solid surface to measure. Its ridges are magnetic field strength: an SDO/HMI synoptic magnetogram covering one full solar rotation (Carrington rotation 2300, 19 July – 15 August 2025). Signed field strength in gauss is mapped to elevation through a signed square-root curve:
elev = sign(B) × √(|B| ÷ 1500) × 30000, clipped to ±32000
The square root spreads the quiet Sun (|B| ≈ 5 G) into visible texture while active regions (|B| ≈ 1000 G) still reach near the ceiling, which is hit at about 1638 G.
Bright ridges are magnetic active regions. Because a synoptic map is stitched strip by strip from a fixed observation point (the Earth!), as the Sun turns, longitude is also time: flying across the map crosses about 27 days of observation.
The representation doesn’t necessarily mean much scientifically, but it looks cool :p
World units and altitude bands
Every body is drawn at the same size: its reference sphere has a radius of 6000 world units, the internal unit everything is measured in. A body’s true radius does not change how big it looks; it only sets the conversion the HUD uses to report altitude in kilometres:
altitude km = altitude wu × (body radius km ÷ 6000)
One world unit is 1.06 km at Earth, 0.04 km at Vesta, and 116 km at the Sun.
Band ceilings are fixed in world units and identical for every body, so the same band spans a different real distance depending on where you are:
- SURFACE below 50 wu · 53 km at Earth, 2 km at Vesta
- ATMO / LOW / CORONA below 1500 wu · 1,593 km at Earth, 66 km at Vesta, 174,000 km at the Sun
- ORBIT below 12,000 wu · 12,742 km at Earth
- DEEP SPACE beyond that
The second band is named for what surrounds you: ATMO on the three bodies with an atmosphere (Earth, Mars, Venus), LOW on the airless and icy ones, CORONA at the Sun.
Past deep space the view keeps zooming out into the system view. From 120,000 wu the globe shrinks in perspective while the orrery camera pulls back; by 1,500,000 wu the body is a dot and the whole system is framed.
Exaggerating height for the sake of seeing Olympus Mons
At true scale there would be nothing to see: Everest is 8.8 km on a 6371 km planet, about 8 world units on a 6000-unit sphere. Relief is therefore exaggerated, by an amount that depends on altitude: ×2.75 near the ground, easing to ×14 at distance, which keeps continents readable from orbit without turning low passes into spikes.
Each body then applies its own factor. Mars is damped to 0.45: Olympus Mons rises 21 km, the tallest relief in the system, and at full exaggeration it swallows the globe. Mercury sits at 0.9, Pluto at 1.4, the Sun at 1.5; the rest are 1.0.
Ceres, Vesta, Enceladus and Charon opt out. They are small enough that their real relief is already a visible fraction of their radius (±1.1% for Enceladus, ±2.3% for Charon), so they are drawn at a fixed exaggeration preserving the true ratio. Vesta is that lumpy: its semi-axes differ by about 60 km.
Logarithmic system
Drawn to scale an orrery is mostly empty: fit Pluto on screen and the inner planets collapse into the Sun. Only radial distance is compressed, logarithmically:
display radius = log₁₀(1 + AU) ÷ log₁₀(1 + 40)
Zero at the Sun, 1.0 at 40 AU, roughly Pluto’s orbit. Everything else is unmodified. Each body’s direction is its true heliocentric position from a Kepler ephemeris (JPL/Standish approximate elements, 1800–2050, J2000 epoch), so ecliptic longitudes, spacing order, and the tilt of Pluto’s 17°-inclined orbit are all correct. Spin and orbital periods come from the same elements.
Architecture
- Everything runs client-side. No server, no build step, no framework. Vanilla JavaScript static files.
- Terrain is processed offline in Python into raw
int16heightfields and hosted as a Hugging Face dataset. Each body ships three tiers (full resolution, ÷4 and ÷16) and loads coarse-to-fine, so the globe paints from the ÷16 tier and sharpens as you descend. Files are fetched once and kept in the browser’s Cache API. - A small WebAssembly module (Rust) decodes and owns the heightfield in memory for the GPU to read. It holds no geometry logic.
- Every frame, WebGPU compute shaders map the grid onto the sphere, cull it against the horizon, select level of detail, and emit the ridgelines. The lines are computed per frame, never stored.
- Camera, Kepler ephemeris and orrery are plain JavaScript. The ephemeris is approximate in absolute terms; relative geometry and motion are correct.
- WebGPU is required. There is no fallback renderer; without it the page says so and stops.